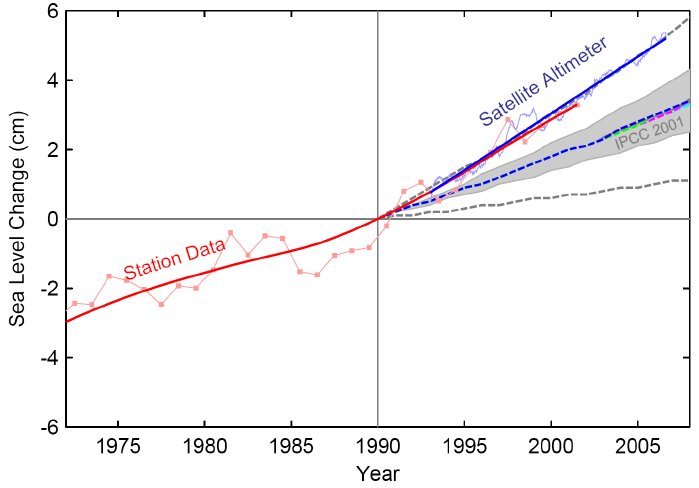
Comparison of the 2001 IPCC sea-level scenarios (starting in 1990) and observed data: the Church and White (2006) data based primarily on tide gauges (annual, red) and the satellite altimeter data (updated from Cazenave and Nerem 2004, 3-month data spacing, blue, up to mid-2006) are shown with their trend lines. Note that the observed sea level rise tends to follow the uppermost dashed line of the IPCC scenarios, namely the one "including land ice uncertainty", see first Figure.
I swiped this from the above critique. I read real climate as a contrarian PoV input. However, it ought to be noted when you have real data and it matches the worst case scenario you ought to think about that a tad.
No comments:
Post a Comment